Slavic Variations of Katherine Over Time
Import Data and Libraries
library(babynames)
library(dplyr)
library(ggplot2)
head(babynames)
## # A tibble: 6 × 5
## year sex name n prop
## <dbl> <chr> <chr> <int> <dbl>
## 1 1880 F Mary 7065 0.0724
## 2 1880 F Anna 2604 0.0267
## 3 1880 F Emma 2003 0.0205
## 4 1880 F Elizabeth 1939 0.0199
## 5 1880 F Minnie 1746 0.0179
## 6 1880 F Margaret 1578 0.0162tail(babynames)## # A tibble: 6 × 5
## year sex name n prop
## <dbl> <chr> <chr> <int> <dbl>
## 1 2017 M Zyhier 5 0.00000255
## 2 2017 M Zykai 5 0.00000255
## 3 2017 M Zykeem 5 0.00000255
## 4 2017 M Zylin 5 0.00000255
## 5 2017 M Zylis 5 0.00000255
## 6 2017 M Zyrie 5 0.00000255names(babynames)## [1] "year" "sex" "name" "n" "prop"library(ghibli)## Registered S3 method overwritten by 'ghibli':
## method from
## print.palette wesandersonGraph Construction
slav_kat <- babynames %>%
  filter(name == "Katarina" | name == "Kateryna" | name == "Katarzyna"
         |name == "Ekaterina" | name == "Katerina"  ) %>%
  filter(sex == "F")
glimpse(slav_kat)
## Rows: 199
## Columns: 5
## $ year <dbl> 1954, 1958, 1958, 1959, 1960, 1961, 1962, 1962, 1963, 1963, 1964,…
## $ sex <chr> "F", "F", "F", "F", "F", "F", "F", "F", "F", "F", "F", "F", "F", …
## $ name <chr> "Katerina", "Katarina", "Katerina", "Katerina", "Katerina", "Kate…
## $ n <int> 5, 5, 5, 5, 5, 13, 14, 11, 11, 5, 17, 9, 18, 6, 22, 13, 22, 25, 1…
## $ prop <dbl> 2.510e-06, 2.420e-06, 2.420e-06, 2.410e-06, 2.400e-06, 6.260e-06,…custom_order <- c("Katarina", "Katerina", "Ekaterina", "Kateryna", "Katarzyna")
slav_kat$name <- factor(slav_kat$name, levels = custom_order)
name.plot <- ggplot(slav_kat, aes(x = year,
y = prop,
group = name,
color = name)) +
geom_line(size = 1) +
labs(x="Year", y="Proportion of Total Applications Per Year", color="Names")+
ggtitle("Variations on a Theme: Slavic Forms of Katherine") +
scale_color_viridis_d() +
theme_minimal()## Warning: Using `size` aesthetic for lines was deprecated in ggplot2 3.4.0.
## ℹ Please use `linewidth` instead.
## This warning is displayed once every 8 hours.
## Call `lifecycle::last_lifecycle_warnings()` to see where this warning was generated.name.plot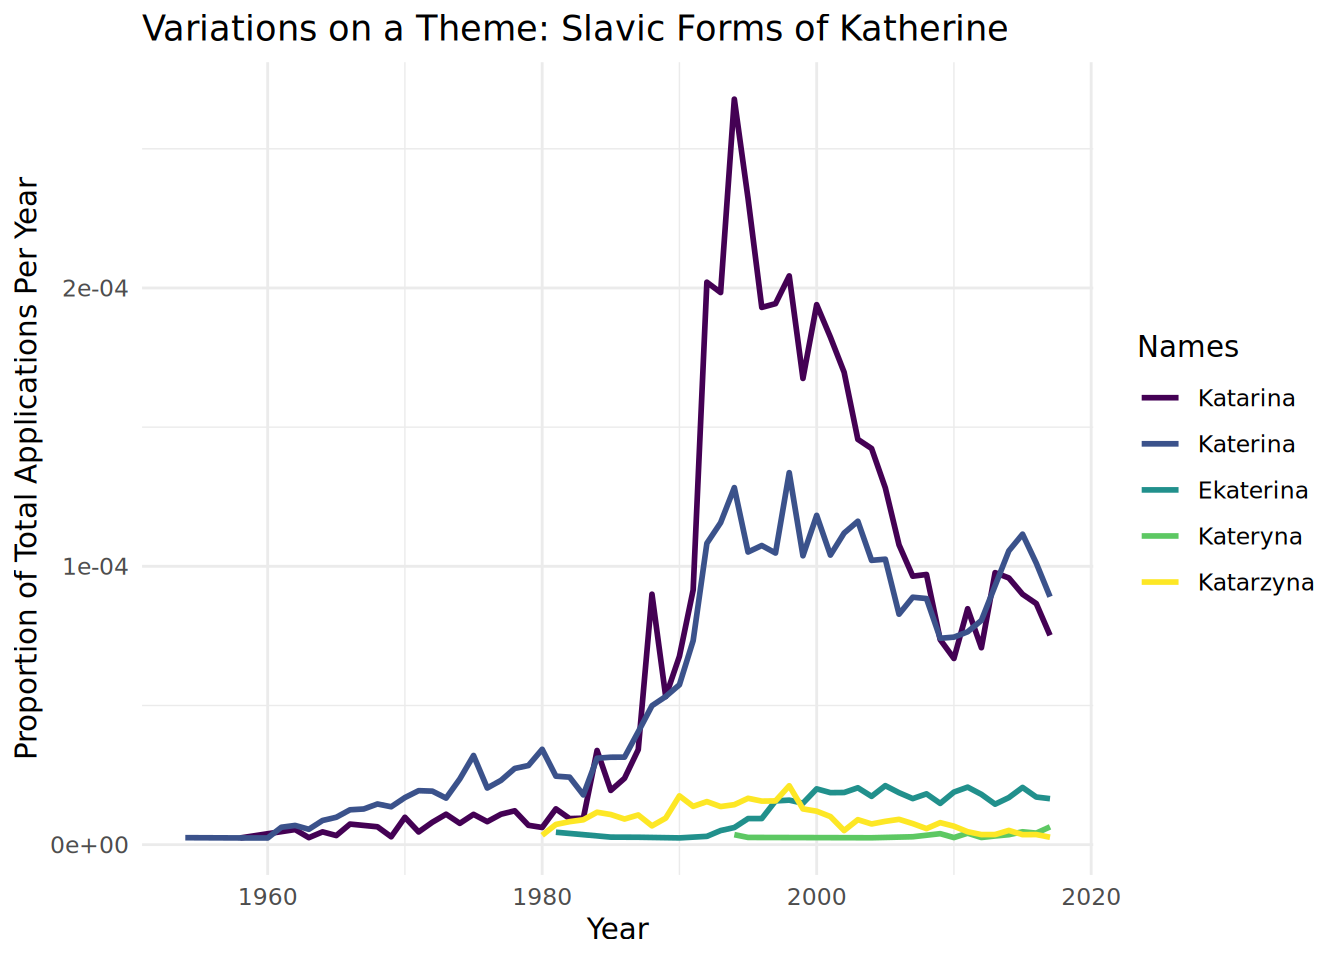
I wanted to plot how the popularity of slavic forms of Katherine changed over time in the US. Growing up, I always wondered why people would lean towards the Katerina spelling instead of Katarina, and now I see that after my birth year (2001), the popularity of Katarina and Katerina are similar. What’s interesting is that before my birth there was quite the boom for Katarinas. I wonder if it will make a comeback…